

After a poor performance in 2015, the first half of 2016 proved to be a much stronger showing for commodities. The S&P GSCI, which tracks 24 of the most liquid investable commodities, was up by 17.42%, which is in stark contrast to last year’s 32.9% loss.
The first half of the year can be broadly characterised as the period when commodity markets finally ended their bear runs, which for many of them like crude oil, lasted between July 2014 and early-2016. Prices rebounded between January and July to such an extent that of all the major asset classes, commodities turned out to be the best performer during the 6 month period.
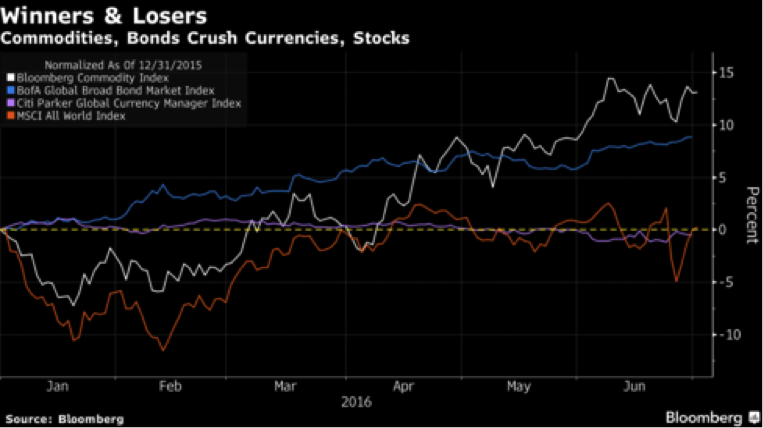
Based on the Bloomberg Commodity Index, the second quarter alone, produced the best quarterly performance by the commodities complex since 2010.
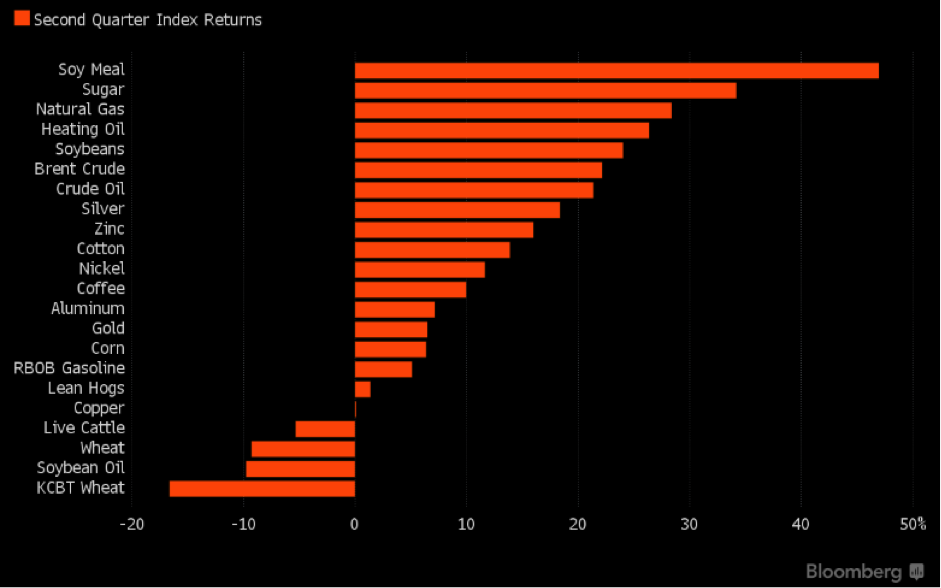
The biggest winners over the 6-month period were silver and gold amongst precious metals, and soybeans amongst agricultural commodities. Zinc, meanwhile, was the best base metal performer, while oil was top of the energy class.
Many of the specific price rebounds came on the back of a rebalancing of global demand and supply. Through a cooling of demand, China’s economic slowdown played a vital role in the dismal performance by commodities. While there has been scant positive news from China this year – and only modestly higher global demand for most commodities – prices have largely been supported by fairly severe cuts in supply. With prices falling to uneconomic levels in numerous markets, large swathes of global production were forced into being shuttered, and many commodity producers having to file for bankruptcy as a consequence. As such, the overall supply contractions pushed the market prices of many commodities higher.
Energy
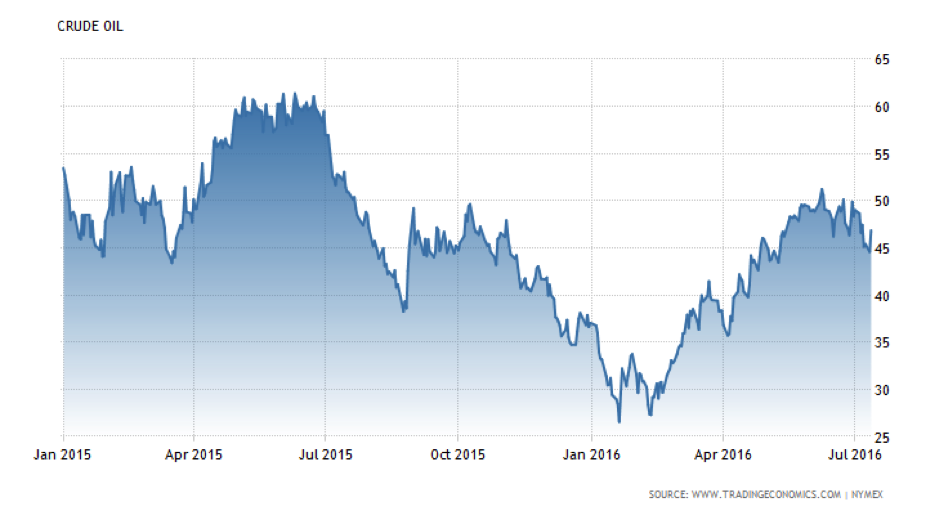
Oil, which posted 30% gains during the first half, is one such example of this rebalancing. By mid-February, oil prices began to reverse course from a collapse that began in July 2014, and from the WTI price touching a 12-year low of $26.05/bbl. Since then, crude has posted a stellar 70% rebound, with prices now trading between $45/bbl and 50/bbl. The rebound has been driven considerably more by global supply factors than demand ones.
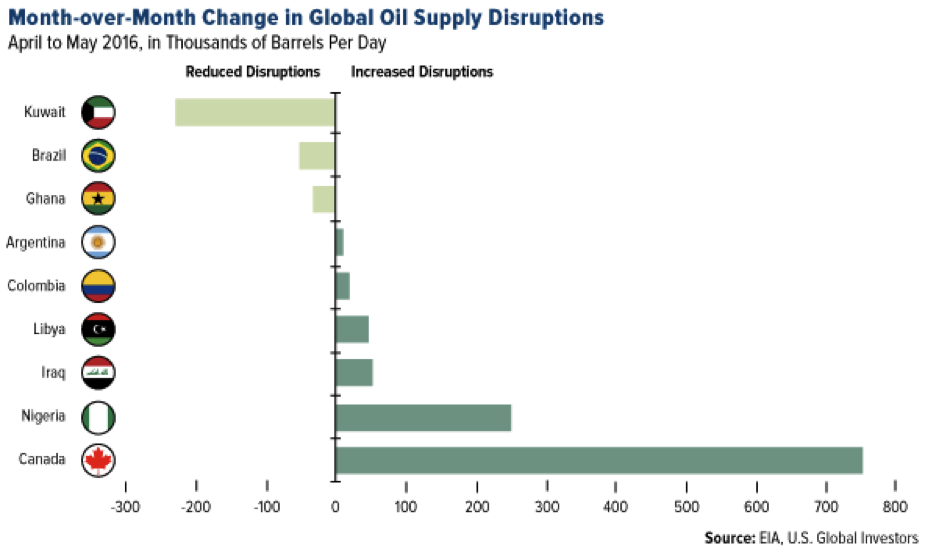
By the end of May, many analysts were stating that the global crude production surplus, which was nearing 2 million barrels earlier in the year, had been massively reduced. Goldman Sachs at one stage asserted that the supply-demand balance had actually flipped into a state of deficit, rather than surplus. Several factors supported this view. Wildfires around Canada’s oil regions, particularly the oil-sands hub of Fort McMurray, Alberta, severely disrupted crude production. At one stage in late-May, almost 1 million bpd of production was shut off, which equates to about 40% of Canada’s total crude output.
Around the same time, a series of attacks by militants caused Nigeria’s oil production to plummet by 50% to 1.1 million bpd, the lowest level in decades. Eni and Shell both declared force majeure on major Nigerian operations, and Chevron also saw much damage to its pipelines and offshore platforms.
Along with the consistent decline in US rig counts during the first half of the year, and with US oil production now at a 2-year low, such factors helped briefly bolster crude prices to levels not seen since July 2015. Failure by OPEC to agree output freezes meant that Saudi Arabia and Russia continued to churn out oil at record levels. Along with more crude coming back online from Iran, oil gains were pared at around $50/bbl, before dipping slightly in June.
Natural gas also shook off a 2-year bear market to post 25% returns in H1, with the second quarter being substantially more positive.
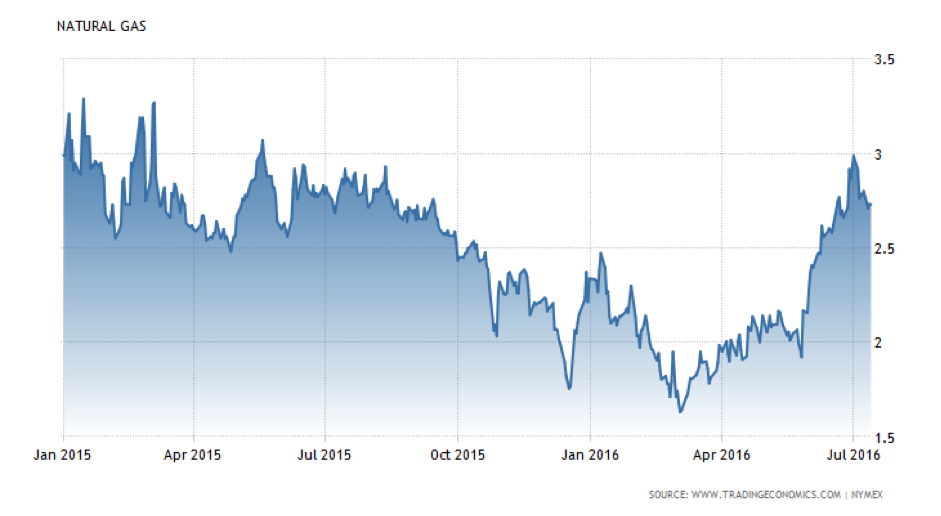
Over a two-week period at the end of May and beginning of June, US Henry Hub natural gas prices rallied by 25%. Along with oil rig counts, the natural gas rig count dropped consistently during the period, with the total number of gas rigs in operation being 63% lower than the previous year by early-June. Forecasts of a hotter summer also boosted natural gas prices, with the warmer temperatures boosting the requirements for gas-powered electricity. Over a longer-term horizon, the US Energy Information Administration projected a steady rise in demand for natural gas, as well as predicting that natural gas will surpass coal this year for the first time ever as the primary energy source for power generation in the US. At the same time, the EIA expects that supply won’t return as quickly, which should lead to a reduction in storage levels and higher gas prices.
Natural gas may have also also benefitted from higher oil prices, as both commodities are often traded in the same basket by funds.
Base Metals
A market rebalancing also helped zinc to end the first half of the year as the best-performing base metal, with 31.97% growth.
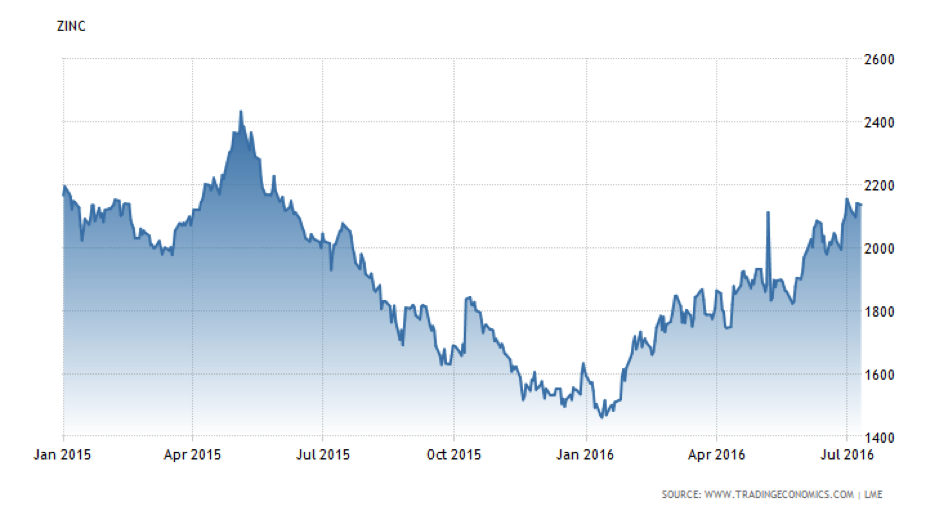
Global mine production of the metal between January and April fell by 8.1% over the same period in 2015, with notable zinc producers Australia, India and Ireland all reporting declines. Zinc prices were also supported by news from the International Lead and Zinc Study Group that overall global zinc mine output is expected to fall by 1.4% to 13.27 million tonnes this year, while demand for refined zinc is expected to increase by 3.5%. Much of this demand growth, moreover, is somewhat surprisingly expected to come from China, which continues to invest in infrastructure in spite of its economic slowdown.
China’s demand for copper, which amounts to 45% of global consumption, however, weighed more heavily on the red metal’s price than other metals. Copper prices remained range bound throughout the first half, ending the period up by a modest 2.85%. On the supply side, there has been little disruption to global copper this year, and new mines have come on board such as Peru’s Las Bambas mine, which recently delivered its first supplies this year, and is expected to reach commercial levels of production by the end of the year. This has meant that the supply cuts that supported price increases for other commodities, were absent for copper.
Precious metals
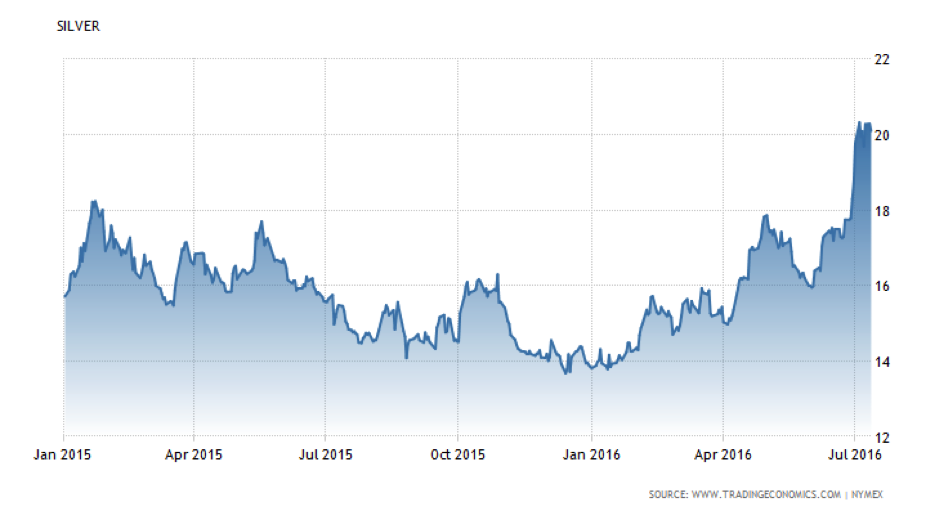
Precious metals were among the first half’s biggest winners, especially silver which came top of the entire commodities class with a 35% gain. Gold also had a stellar 6 months, with prices rallying by nearly 25%.
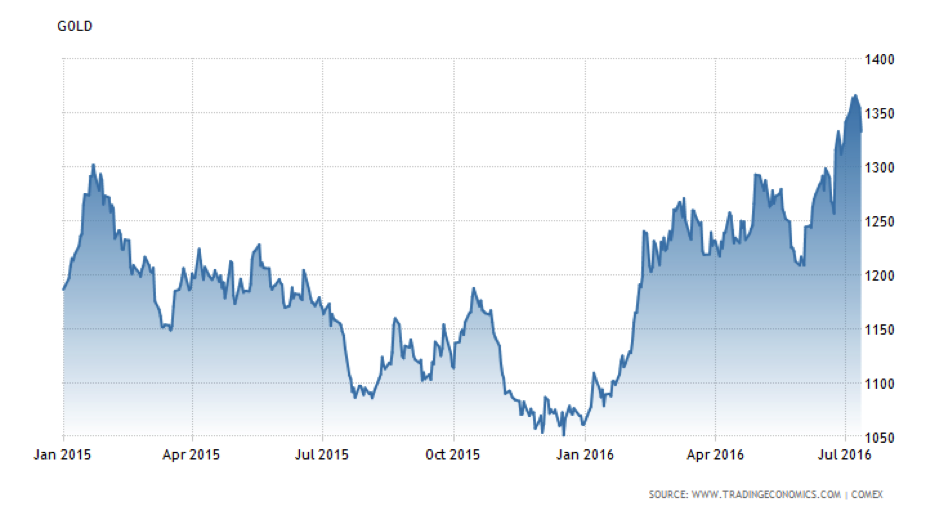
Several reasons underpinned this bullish sentiment. Across the 6 month period, the US dollar weakened significantly, with the DXY index, which measures the dollar’s strength against a weighted basket of foreign currencies, including the euro, the British pound and the Japanese yen, falling from 98.7 to 95.7. This made it cheaper to purchase dollar-denominated commodities, including precious metals. As such, demand for such commodities went up, along with their prices.
Another major reason for precious metal buoyancy was simply the lack of decent alternatives. Given that much of the world has been plagued with negative interest rates, such as Germany and Japan, bond markets have been distinctly unattractive this year. According to recent Bloomberg analysis, a mammoth $7 trillion-plus of government bonds offered yields below zero globally this year. This reality has spurred investors to seek safety in alternative investments, with commodities – and precious metals in particular – being used as ‘safe haven’ assets, a good place to store wealth.
This flight to safety was particularly exacerbated by the UK’s decision to leave the European Union. Brexit triggered a wave of uncertainty and volatility across many financial markets, which resulted in investors seeking safety in gold and silver. According to CNBC, there was a flow of $335M into precious metals due to post-Brexit concerns, in the week that followed the vote. Much this uncertainty remains today, which has continued to support gold and silver prices.
One of the reasons silver rallied so dramatically was also likely due to the gold-silver ratio, which charts the price of an ounce of gold relative to that of silver:
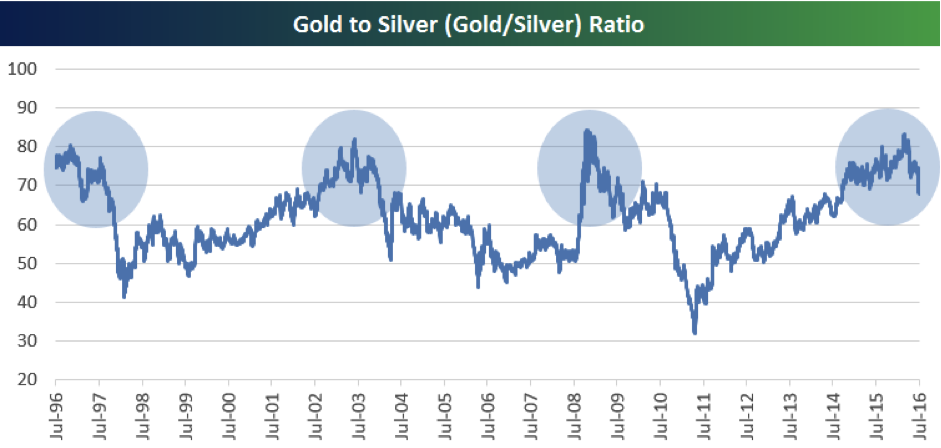
A higher ratio signals that gold is outperforming silver, which has been the case recently from a historical perspective (as shown above). Furthermore, whenever this ratio has exceeded 80 in the last 20 years, silver has rebounded spectacularly, which in turn has meant that an 80-plus ratio hasn’t remained for any length of time. In 2016, this has once more been the case, with traders specifically buying silver to reverse the ratio.
On the agricultural side, soybeans was the top performer during the first half, gaining almost 35%.
Agricultural Commodities
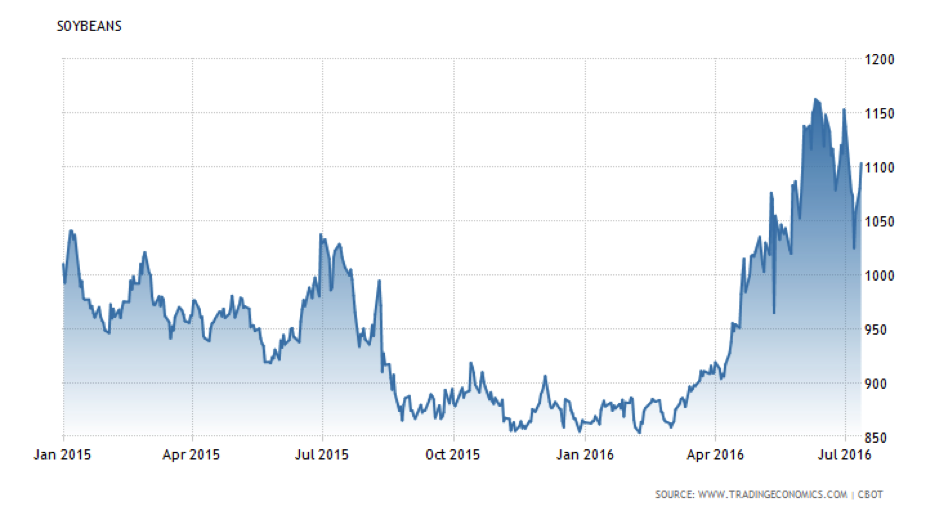
The commodity only has 3 major exporters in the world – the US, Brazil and Argentina. Two of those countries suffered supply shocks during the period. Flooding in Argentina caused soybean farmers to lose around 1.5 million hectares of potential supply; while in Brazil, major droughts have led to expectations of lower soybean harvest forecasts.
The lower production of the current growing season is the first drop in yield in five years, which is expected to lower stock levels by the beginning of next season. End-of-season stocks are estimated to shrink to 68 million tons, the lowest in three years and a downward revision from earlier estimates of 73 million tons. According to estimates from the World Agricultural Supply and Demand Estimates Report (WASDE), moreover, soya production for the 2016/17 season, at 324 million tons, will be eclipsed by total soya usage at 328 million tons. As such, the thinning of stocks and expected deficit has been causing soybean prices to rally.