CWAN Biannual Commodities Update July 2019
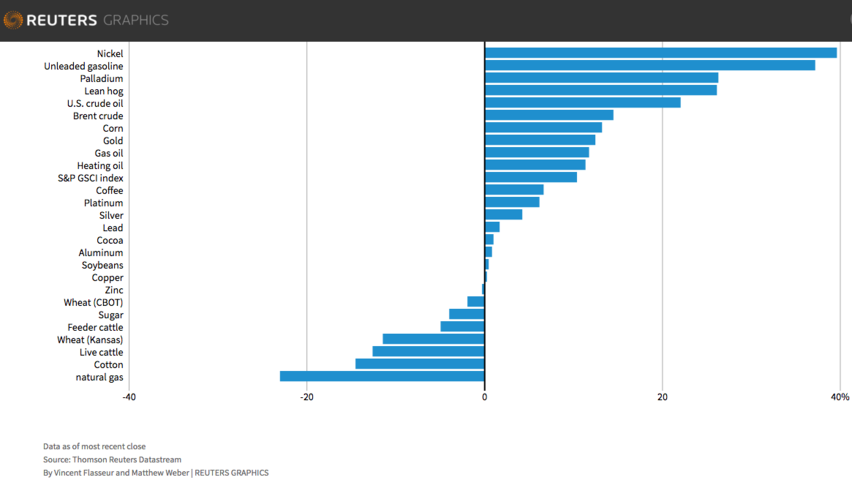
It was a generally positive first half of the year for commodities, with some surprise underperformers. The prospect of trade wars continued to loom over commodity markets during the first half of 2019, adding to gold’s safe-haven status and introducing much more volatility into the trajectory of other commodity prices like copper and silver.
Trade talks started the year off on a positive note, with a US delegation heading off to China to resume talks. President Donald Trump claimed substantial progress was being made and that we could expect the mother of all trade agreements. But the talks came to nothing in early May, with Trump walking away from the table after accusing the Chinese contingent of backing out of key parts of the agreement.
Within a week of closing down the talks, the US hoisted tariffs up to 25% on $200bn in Chinese goods, with threats of more to come. The Chinese responded with their own tariff hikes on $60bn in US goods. This tit-for-tat tariff engagement had a profound effect on financial market and economic sentiment, as well as on prospects for world economic growth.
During the second quarter, the dovish tilt to monetary policy in the major developed economies intensified, with investors pricing in as much as a 50-basis point “insurance” cut by the US Federal Reserve at the July meeting. The forecast rate cut is seen as insurance in that economic conditions haven’t deteriorated as markedly as the rate cut would suggest. However, it is believed that reducing official rates before then would enable the US Fed to get ahead of the curve.
Trade tensions also subsided when Trump engaged in side line discussions with Chinese President Xi Jinping. These resulted in an agreement to continue trade discussion and to hold off on any further trade tariffs.
Crude Oil
Concerns about oversupply continued to dominate the crude oil industry during the first half of the year, with the trade wars and US/Iran tensions adding to crude oil price shifts in the first half of the year. However, this didn’t stop crude oil being the best performing commodity during the first half of the year, gaining almost 30% and outperforming all other commodities.
With all these cross-currents influencing the oil market, oil prices had a weak start to the year, with Brent crude oil price falling to a low of $53.80 in January and West Texas Intermediate down to $45.41. Oil prices then rallied to highs of $74.04 and $66.30 for Brent and WTI respectively in late April in the wake of the attacks on two tankers in the Strait of Hormuz, with the US accusing Iran for the attacks. In July, crude oil prices had eased back to $64.26 and $58.07.
Getting the supply-demand balance right remains a global challenge. OPEC and some non-OPEC countries agreed to reduce output by 1.2 million barrels a day. However, the US broke ranks, taking oil production to new highs.
It was a tough first half for Canada’s oil industry. While supply looked healthy, transporting production to important markets like Asia and Europe proved a significant challenge due to continued infrastructure constraints. In an attempt to alleviate these bottlenecks the Liberal government approved the politically fraught expansion of the Trans Mountain pipeline. The pipeline will almost triple transport capacity but it will be at great expense and will take some time to be in operation. The Trans Canada Keystone project also received a new permit after its future has been locked in legal battles.
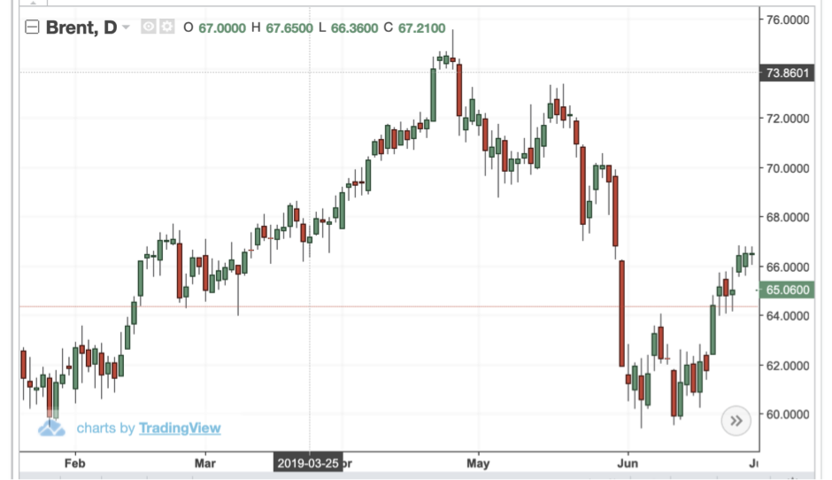
Looking forward, OPEC oil supply is still expected to outpace demand, notwithstanding the OPEC-agreed production cutbacks. The organization expects oil demand to come in at 1.2 million barrels per day during the second half of the year, while oil supply is estimated to be some 600 thousand barrels a day ahead of that at 1.8m barrels a day. But given the uncertainties surrounding the trade talks, the Chinese economic slowdown and geopolitical tensions centred on Iran, it’s difficult to predict what will actually happen with any certainty.
Natural Gas
Natural Gas was the poorest performing commodity during the first half of the year, with supply far outstripping demand despite it being a cleaner energy source than coal. Henry Hub Natural gas spot prices came off more than 20% during the first half from $3.11MMBtu in January to $2.4 MMBtu in June 2019. The AECO price, Canada’s natural gas benchmark, was more volatile and experienced a much steeper decline over the six-month period. It came off more than 55% from $1.38MMBtu to $0.61MMBtu by June. Oversupply stemmed primarily from the US where output expanded 44% and gas exporters, including Russia, all competed for Europe’s export demand. Costs of exporting gas to Asia are looking unattractive for now.
Canada is falling behind its keenest competitor, the US, in the natural gas industry but it is gearing up to complete its first sizeable LNG facility. However, transportation challenges will need to be overcome if Canada hopes to ramp up its natural gas exports materially.
Russia is set to add significant supply to the natural gas industry when it completes its Nord Stream II gas pipeline, which is more than half way along to being done. This will bring about 1.9 trillion cubic feet a year of natural gas to the market.
There is an expectation that current low prices could accelerate the shift from coal to gas energy demand, which would support gas prices going forward. The International Energy Agency has pinned the increase in demand for natural gas as an alternative to coal at 1.6% a year for the next five years. However, US natural gas production is likely to continue to put prices under pressure and the positive impact of European winter demand is yet to be determined after last year’s mild winter.
Gold
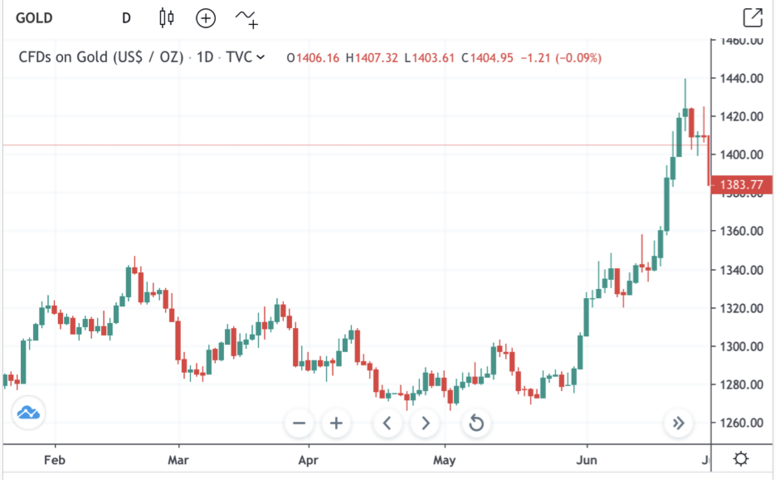
It was a relatively uneventful first half of the year for gold until June when the precious metal reasserted its position in the minds of investors as a safe-haven asset, climbing from $1,280 an ounce to more than $1,400. The rally to levels last seen in 2013 was based on the expectations that negative government bond yields would continue to be a feature of the investment landscape for some time to come amid slowing growth and increasingly dovish central banks. Geopolitical tensions also underpinned the rally in the precious metal late in the second quarter.
Looking forward, any signs of subdued, to weaker, macro-economic conditions could be favourable for the yellow metal. A weaker dollar would also provide support, particularly given that President Donald Trump is in favour of the currency achieving a competitive level against the Euro and other developed market currencies, including China. Thus the expectation is that gold will either rally further or remain at its current elevated level after breaking out of its multi-year range of between $1,100 to $1,300 an ounce.
Silver
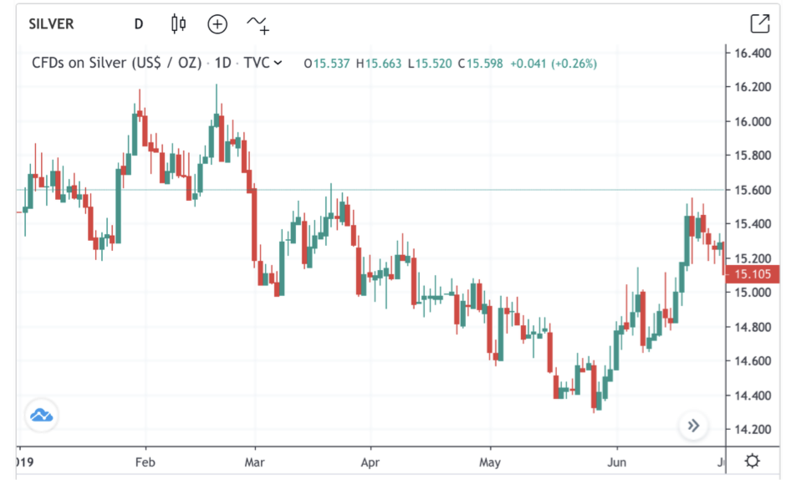
Silver didn’t experience quite the same upward momentum as its gold metal counterpart in June. While the precious metal’s price did reach a high of $15.41 an ounce in late June, it ended up advancing a more modest 1.3% during the second quarter than gold, still leaving silver in the red for the first half of the year as a whole. The June rally was prompted by the expectation that the US Fed would cut interest rates at its end of July monetary policy meeting. One explanation for the modest performance of silver relative to gold is that half of the demand for silver stems from industrial applications and thus is more sensitive to an economic slowdown.
Copper
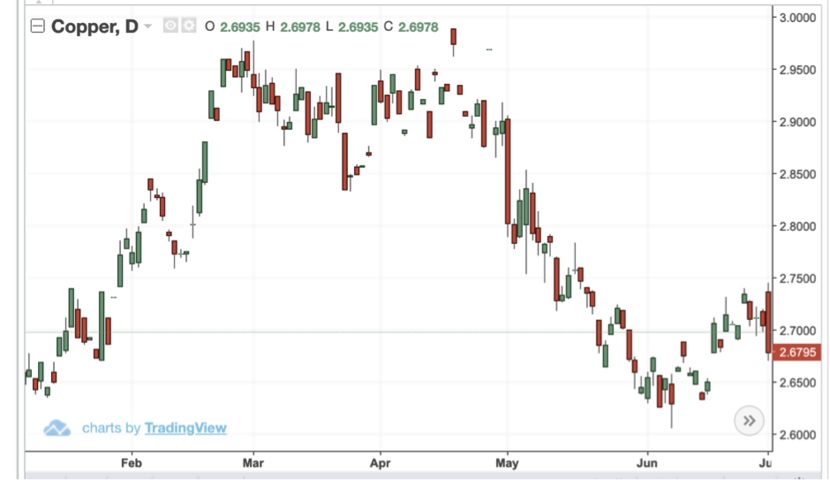
It was also a surprisingly poor first half for copper, in contrast to favourable expectations for the red metal given the ongoing shift to renewable energy systems, which rely on copper as a critical source material. Copper prices plummeted more than 20% for the six months as a whole, wiping out the temporary rally in the base metal which began in March and lasted through to May, when the price dropped almost $200 in one day.
Trade tensions and the tariffs imposed on China were seen to be the biggest contributor to the downturn in the copper price. Others question whether there is justification in the weakness in the price, given underlying supply-demand dynamics that are, in fact, favourable. Supply disruptions and expected continued demand for the base metal are projected to help the copper price move higher during the second half of the year.
Lumber
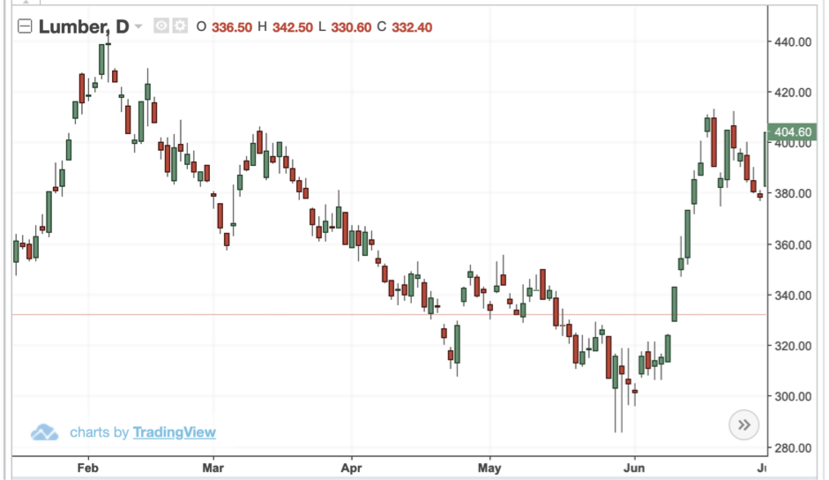
Lumber had a choppy ride during the first half of the year but ended up being the fourth best performing commodity during the six month period. Lumber price reached a high of $536.20 in February before declining to $378.90 at the end of June. Nevertheless it gained 8.3% in the first quarter, 5.2% in the second and for the half year was ahead almost 14%.
Prospects for the soft commodity could remain positive, with interest rates expected to decline and thus boosting the housing market, there is a view that the lumber prices could benefit going forward.
Corn and soy beans
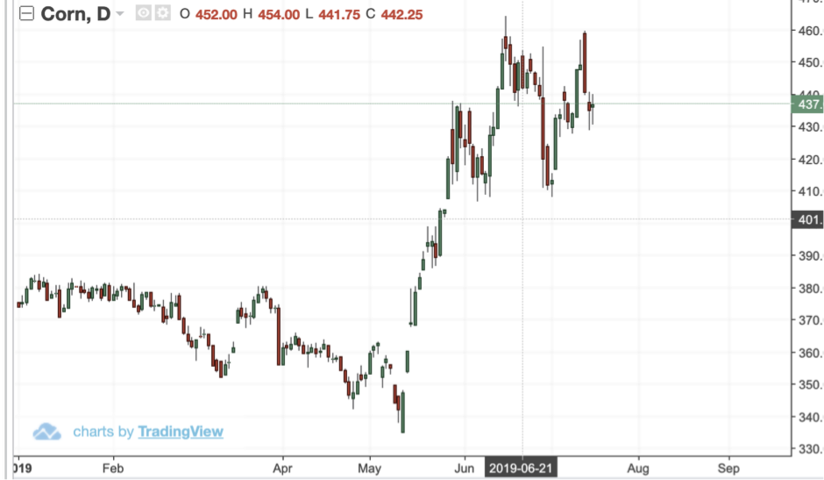
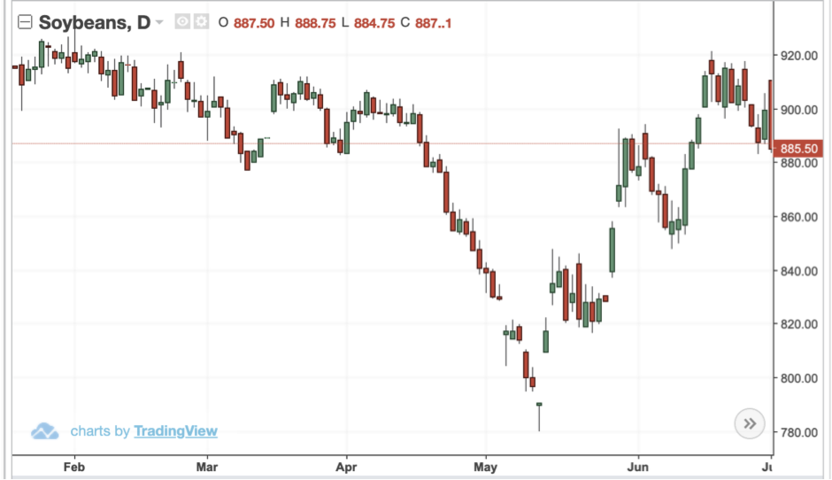
Soy bean prices lagged corn prices, with the latter experiencing a strong first half of the year, up about 12%. Soy beans were caught up in the trade tensions, with the prospect of hefty tariffs being imposed on China, the largest importer of soybeans, weighing on the price and dragging prices down in late April/early May.
There are concerns about the likely size and quality of the soy bean and corn harvests this year given the heavy rains in the US Mid-West and the fact that plantings have lagged historical averages. In fact, based on the US Agricultural Department World Agricultural Supply and Demand Estimates (WASDE) June report’s yield forecasts, the US may see its smallest corn harvest since 2015/16.
