
 2015 was a disastrous year for commodities. The S&P GSCI, which tracks the performance of 24 of the most-liquid commodity markets, ended 32.9% down over the year, the fourth-largest loss on an annual basis since the creation of the index in 1970. 2015 also marked the third consecutive annual loss for the GSCI, a record which the index has not experienced previously. The recurring explanation for the poor performance of many commodities was a combination of global supply gluts combined with slowing global demand, particularly from China. A total of $500bn was withdrawn from emerging markets by investors during the year, which impacted local currencies and thus made dollar-denominated commodities more expensive.
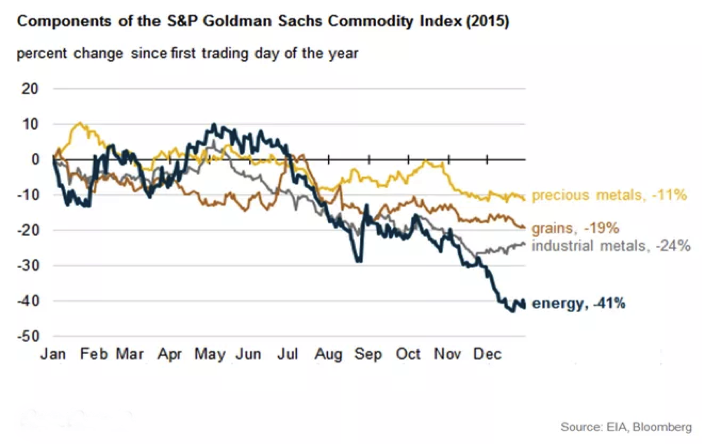
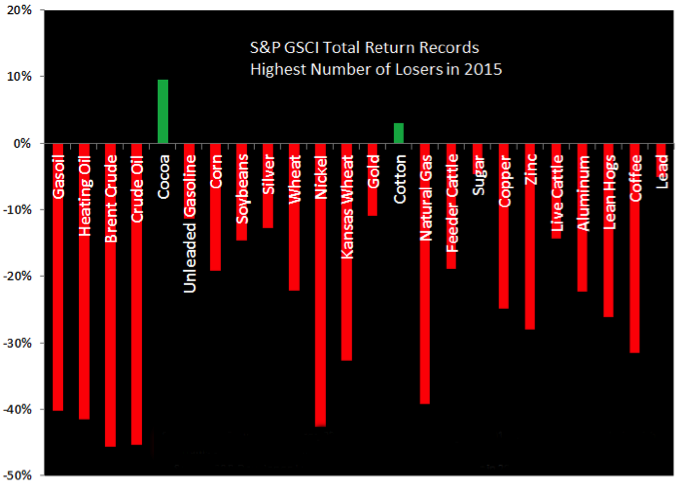
Energy was the worst performing of all commodity sectors, while 22 of the 24 markets suffered losses over the course of the year:
Source: Business Insider
Energy Price Collapse Continues into 2016
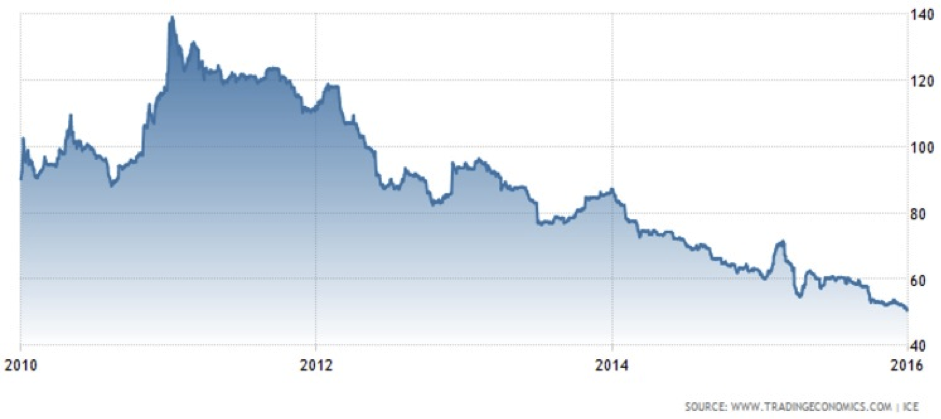
Much of the complex was pulled down by oil, which continued its price collapse from 2014. The GSCI return from WTI crude and Brent crude across 2015 was -45.3% and -45.7%, with futures prices for the two grades falling by 30% and 35% to end the year at $37.04/bbl and $37.28/bbl respectively. December also saw year-lows being reached for both grades, with WTI posting a 7-year low of $34.53/bbl on December 14, and Brent recording $35.98/bbl on December 23, its lowest level since 2004. The most influential factors in oil’s downward spiral was the failure by OPEC members to close the taps in a bid to gain market share from non-members, particularly the US, Russia and Canada; indeed, the group’s output reached a record 31.88m bpd in July and has only marginally declined since then. The US shale industry proved to be surprisingly resilient in the face of declining prices, competitive pressure from OPEC and a fall in the number of US drilling rigs, as the country’s oil producers supplied the market with more crude than expected. The lifting of the US export ban on countries outside of Canada, in acknowledgement of the industry’s growth, also helped to sustain US oil producers. Following the US-Iran nuclear deal, expectations that sanctions will be lifted and a substantial amount of Iranian crude coming back on line in 2016 also added to the bearish sentiment.
A slowing Chinese economy, coupled with market expectations throughout much of the year with a US interest rate increase, kept global demand muted in comparison. Global oil production, therefore, outpaced demand during the year, creating an unprecedented supply glut which exerted considerable downward pressure on prices.
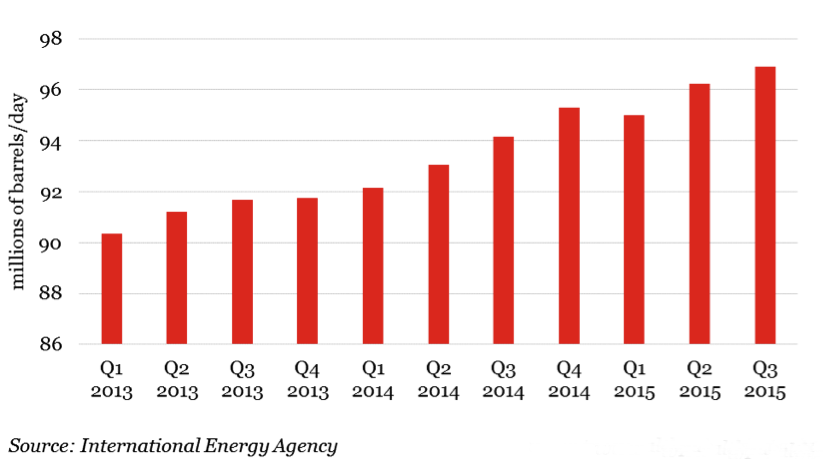
Global Oil Production
Furthermore, WTI and Brent have carried on heading south in January, settling at 2016 lows of $31.05/bbl and $30.88/bbl on January 14 (and marking 10% and 14.2% declines since the start of the year), although the next day has seen intra-day lows of $29.47/bbl and $29.44/bbl being posted. These levels mark 12-year lows for both indices, and follow recent reports that Iranian oil will hit the market sooner than expected.
The world’s cheapest barrel of oil also reached an all-time low in January 2016. The Western Canadian Select grade, which is made up of heavy conventional production and bitumen blended with synthetic crude and condensate, dropped to $14.20/bbl on January 14, the lowest since tracking began in 2008, due to little demand for such a heavy grade of crude, especially given the record supplies of benchmark-quality crude coming from the US.
Saudi Arabia has also indicated it might sell a stake in its national oil company, Saudi Aramco. The potential listing of Aramco suggests that the chief OPEC producer is expecting a sustained period of low oil prices in 2016, which would in turn mean further low revenues. An IPO, therefore, would raise billions of much-needed dollars for the kingdom.
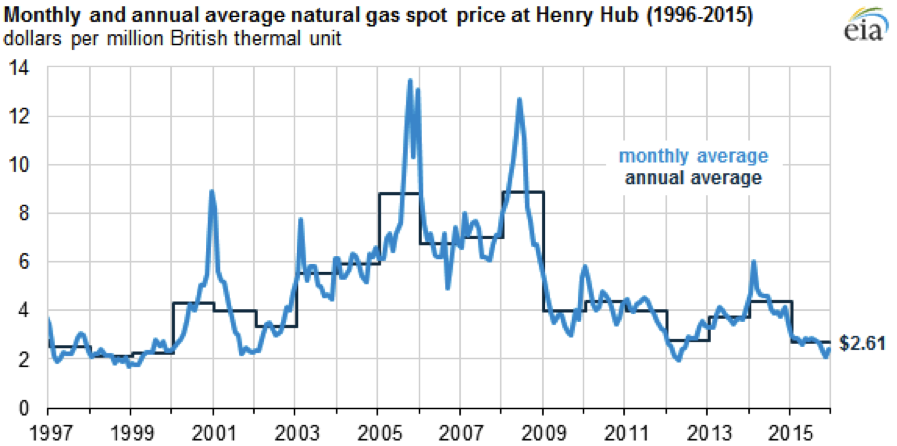
The energy segment was also brought down by falling natural gas prices. According to the US Energy Information Administration, the average price in 2015 of the benchmark US index Henry Hub in Louisiana averaged $2.61 per million British thermal units (MMBtu), marking the lowest annual average since 1999 as inventory levels reached record levels. Moreover, prices dipped below $2.00/MMBtu at the end of the year for the first time since 2012, principally due to the warmer-than-normal weather in Q4.
Metals Slumped as China Fails to Absorb Global Supply
Like energy, base metals also ended the year dismally. Nickel was among the worst-performing metals with a 42% loss over the year, while Copper ended up losing 25% of its value. Concerns over the declining economic health of China led the rout. China is the biggest constituent of global demand for metals, accounting for 45% of the world’s copper consumption, and is also the biggest importer of the metal, generating concern that the country will continue to absorb less of the buoyant global supply. Copper is used extensively in the power, manufacturing and construction sectors, and in a huge variety of goods including wiring, phones, cars and plumbing; its versatility, therefore, makes it highly sensitive to economic movements.
One of the most obscure metals, however, proved to be the worst performer of all commodities. Molybdenum is used as a major component in steel building materials and is also significantly employed to harden steel drills used to extract oil and gas from deep underground. Indeed, about half of the metal is produced as a by-product during the extraction of other metals, especially copper. In 2015, molybdenum’s production exceeded demand by 40.9 million pounds, the biggest surplus in 13 years, according to Bank of America. In fact, the bank has estimated that the surplus will exist until 2020. This excess, coupled with the oil price collapse that has slashed demand for oil extraction equipment and has therefore reduced demand for molybdenum, resulted in dramatic losses during the year, with molybdenum oxide prices crashing to a 12-year low of $US4.616/pound in November.
On the precious metals side, markets were similarly depressed, with double-digit losses experienced in all four major markets – gold, silver, platinum and palladium. Gold finished nearly 11% down over the year, ending on the final day at $1,059 per ounce and marking the third consecutive year in which the yellow metal has lost value – its worst run since 1996. Again, China’s slowdown is the main contributor to this rout, although the US Federal Reserve’s rate increase – along with further rate hikes predicted by Yellen et al. during 2016 – supported the strength of the dollar, which in turn made gold more expensive when priced in foreign currencies. This has dissuaded investors from moving funds into gold, either as an investment option, a storage of value, or as a hedge against inflation.
Coal Continues Multi-Year Weakness
Coal’s downturn continued unabated in 2015 with a 23% price decline during the year, marking 4 years of heavy, consistent losses:
Weaker Chinese consumption, a global economic slowdown, competition from low natural gas prices and tougher emissions standards, and increased climate change awareness have been among the main reasons for the ongoing coal price collapse. Indeed, a divestment movement has gained much traction during the year – at the coal industry’s expense – whereby investors controlling approximately $2.6tn (estimated as of September) have committed either to reduce or to completely liquidate their holdings in fossil fuel companies. Campaigners concerned over climate change issues have argued that investors should not finance activities leading to high greenhouse gas emissions. The largest investors that have sold or have promised to sell shares in coal companies include the University of California, Norway’s state pension fund, and Nordea (the largest Nordic fund manager). This has caused coal companies to massively shed value; Peabody Energy, the largest US coal producer, for example, lost over 90% of its value in 2015.
Nevertheless, much like the OPEC, coal producers have been increasing production in a bid to eliminate high-cost producers from the market. This supply increase added to the dampening of prices throughout the year.
Soft Commodities a Bright Spot in 2015
One of the few bright spots for commodities was provided by a handful of soft commodities. Cocoa and cotton ended the year in positive territory, with cocoa being the best-performing commodity in 2015, up 10.9% at $3,207/tonne. Demand for cocoa has been strong during the year, mainly thanks to India and China, where chocolate demand has been growing at 17% and 9% per year respectively since 2010. Supply has not been able to keep up – the strong El Nino climate phenomenon this year has translated into a rain shortage for key cocoa-growing areas, such as West Africa.
Sugar futures also ended the year 5% higher. After 8 months, sugar seemed destined to post huge losses for the year, having touched a 7-year low of 10.13 cents per pound in August. This was mainly due to the weakening currency in Brazil, the world’s largest sugar-producing country, which encouraged producers to supply more for the export market, where output was denominated in increasingly stronger (and therefore more profitable) dollars. A major turnaround in the sugar market was then witnessed during the final four months of the year as the approaching marketing season, which runs from October 2015 – September 2016, was forecast to experience a production deficit for the first time since 2009. This was mainly the result of the strong El Nino, which severely limited much-needed rains in both India and the EU, the world’s second- and third-biggest sugar-producing regions. Dry conditions were, therefore, expected to limit supply in 2015/16, which in turn led to a price rally and resulted in sugar futures recording a remarkable turnaround.
Coffee futures struggled throughout the year, however, eventually posting a 24% loss to settle at $1.2640/pound. Prices tumbled, thanks mainly to Brazil, the world’s biggest producer and exporter, which experienced extensive rainfall and thus boosted crop yields. As with sugar, the declining real spurred Brazil’s coffee farmers into boosting export supplies in order to receive dollars in return. The US Department of Agriculture has therefore predicted that global coffee production will top consumption for the sixth straight year. US retail prices for coffee have, as a result, fallen significantly, with November’s $4.412 per pound being the lowest price recorded since 2011.
Soft commodities are now being predicted to be the commodity market’s best hope for positive returns in 2016, thanks mainly to the current El Nino, which has been described extensively as the strongest since 1997 and is expected to curtail crop plantings during the year. For the rest of the complex, however, the outlook remains gloomy; indeed, even early January has seen a sustained commodities sell-off following China’s surprise yuan devaluation and continuing stock market turmoil, implying that demand for raw materials from the world’s second-biggest economy will continue to weaken this year.
Moreover, the Baltic Dry Index in January has already seen all-time low records being broken on more than one occasion. The index, which tracks the price of shipping dry bulk cargoes (iron ore, coal and grain, for example) by sea, is often used as a bellwether indicator for global trade and economic conditions. It has fallen in line with China’s economic slowdown and has no doubt extended losses following the country’s recent stock market woes. January 11 saw the index reach a new record low when it decreased by 14 points to 415 points.
Given the difficulty in pinpointing where most of these commodity markets will trend, it is wise to avoid forecasts that focus on exactly what levels will be attained in the short term. It is perhaps more sensible to identify opportunities that appear to be meaningfully undervalued – based on fundamental analysis – and position your investment exposures with a long-term view of the risk/reward situation.