

 Commodities markets struggled during the first half of 2015, as most asset classes experienced an overall price decline during the period. The S&P GSCI – a benchmark measure of composite investment performance in 24 liquid commodity markets across energy, metals and agricultural products – produced a 5.4% return overall in H1, mainly thanks to the oil price rally during the second quarter. Almost every other commodity delivered negative year-to-date (YTD) returns.
Oil
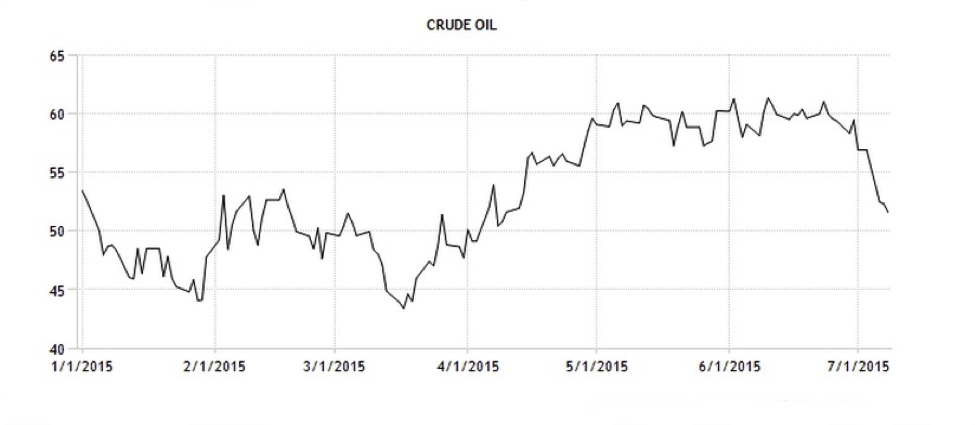
WTI futures price (Source: NYMEX | Trading Economics)
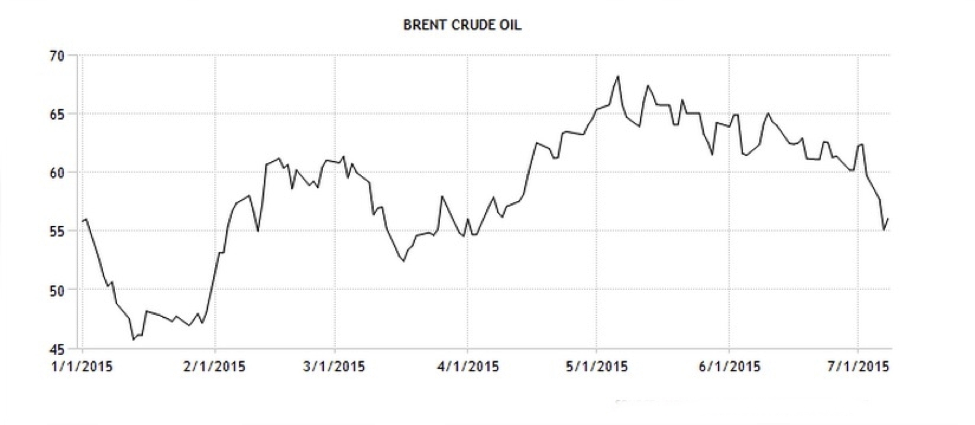
Brent futures price (Source: ICE | Trading Economics)
Both WTI and Brent futures prices initially continued 2014’s bear run before hitting a plateau during the first quarter of the year. Two main factors dominated the narrative during the first half of the year: China’s economic slowdown and US/OPEC oversupply. Supply gluts in Cushing, Oklahoma, and the Permian Basin also ensured that WTI traded at an approximate $5/bbl discount to Brent throughout the period. Saudi Arabia, OPEC’s dominant member, produced crude at an average of 10m bpd during the period, more than the 9.7m bpd it was generating in H1 2014. Total OPEC output finished H1 at its highest level since 2012. Non-OPEC output also rose during the period, with the US, Canada and Russia as the key contributors. US shale production in particular exhibited continued resilience in the face of low oil prices. According to research by Emirates NBD, the global crude market surplus peaked in Q1 at 1.8m bpd and has since fallen, which partially explains the recovery prices staged in Q2.
Thanks to the moderate rally in the second quarter, WTI ended H1 up 11.6% from the start of the year, and Brent futures were up 10.9%. Despite the recovery, prices were still some 44% lower than at the end of H1 2014, and well below the 5-year average. The rebound during Q2 can be attributed in part to higher global oil demand, which, according to the International Energy Agency (IEA) expanded by 1.6mn barrels per day (bpd) in H1. Emerging markets are responsible for much of this demand growth, although demand from OECD Europe has also contributed solidly, leading the IEA to recently revise its demand growth forecast for the region up by 80k bpd.
Since the beginning of July, however, both WTI and Brent have declined by more than $6/bbl to date. The ongoing chaos in Chinese stock markets has helped to drive prices back down to virtually the same levels as the beginning of January.
North American Natural Gas
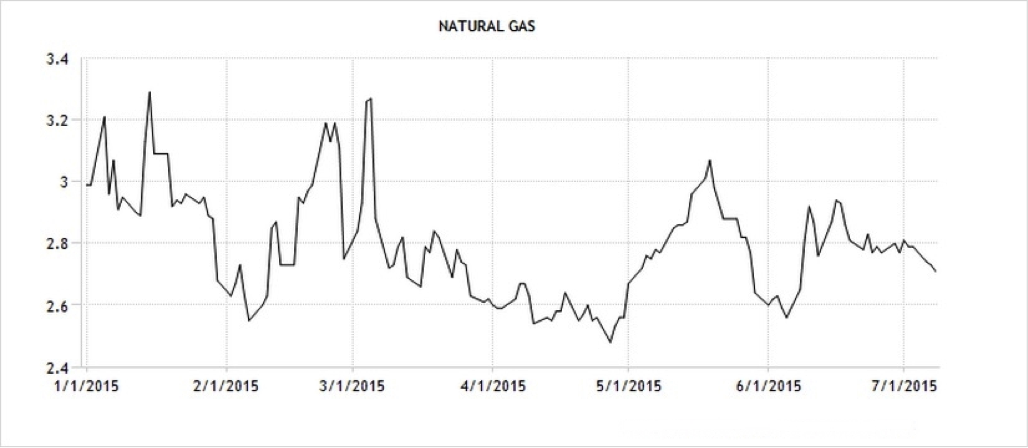
Henry Hub futures (Source: NYMEX | Trading Economics)
Henry Hub natural gas futures remained range-bound throughout the first six months of 2015, fluctuating around 2.9/MMBtu during the first quarter and declining marginally during the second quarter, with the price in May reaching its lowest in almost 3 years. By the end of H1, prices had fallen by 2% due to an increase in US production and falling oil prices that lowered the cost of competing fuels. Average industrial demand for natural gas was expected to increase in 2015 by around 4% at the beginning of the year. However, by the end of the first half of the year it had dropped by almost 1% to 21.7bn cubic feet per day from 22 bcfd a year earlier, which also slightly dampened prices. This was mainly due to the milder winter experienced this year, compared to 2014’s harsh cold in major industrialized regions such as the US Midwest and Gulf Coast.
Precious Metals
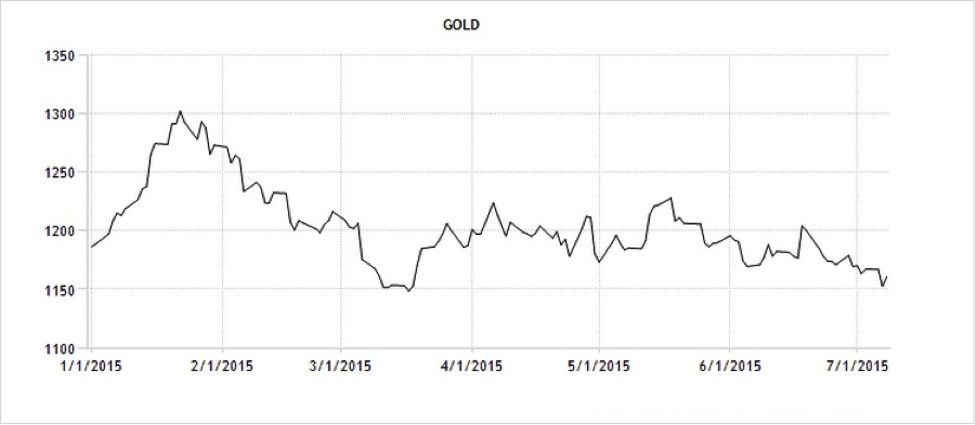
Gold futures (Source: COMEX | Trading Economics)
The yellow metal has remained fairly range-bound throughout the first six months of the year, with a rally in Q1 to $1300/oz being pared back to $1200/oz by the end of the quarter. During much of the second quarter prices oscillated around $1200/oz. While there has been no discernible direction for gold prices during the period, the major factor influencing 2015 price levels has been the expectation of a US interest rate hike. Soft physical demands from China and India have also played their part in removing support for gold prices so far, while a strong dollar for most of the six months has made it relatively expensive for foreign funds to be converted into dollars, gold’s principal denominated currency.
The current gold price still remains well under the levels experienced between 2011 and 2013, when prices were comfortably in excess of $1400/oz. This has posed problems for gold-producing majors such as Barrick Gold, the largest producer in the world. Barrick is currently lumbered with $13bn of debt, thanks to being saddled with high mining costs on projects initiated during recent years. Barrick spent billions on an underperforming copper mine in Zambia, and was then forced to halt the development of its Pascua-Lama mine on the border of Chile and Argentina, after spending over $5bn. According to Macquarie Group, the two mines have cost Barrick $15.9 billion. Furthermore, its share price has fallen by 72% between the beginning of 2012 and July 10, 2015.
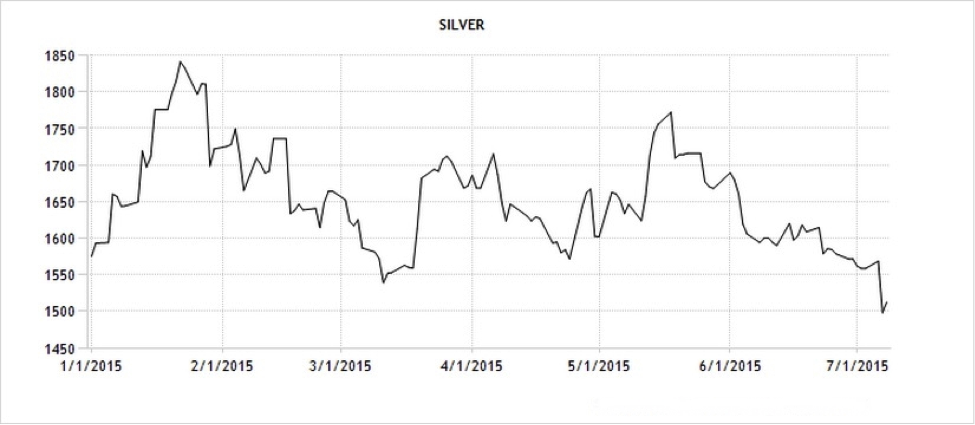 Silver has marginally outperformed gold in H1, with prices remaining around $16.50/oz for most of the period, save for a rally in Q1 to just shy of $18.50/oz. This was brought on mainly due to the establishment of the ECB’s quantitative easing programme, which was expected to boost demand in the eurozone. The price has sharply dipped in July, however – again, a symptom of the collapsing Chinese stock markets, raising concerns that there will be a continued decline in demand for the metal.
Base Metals
The best performing base metals in H1, lead and zinc, fell by 5.3% and 8.2% respectively, which might give some indication of just how poorly the asset class has performed so far this year.
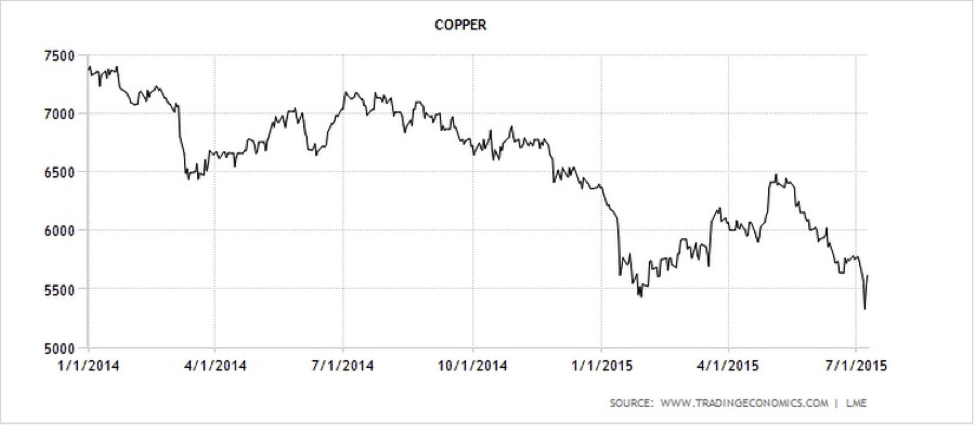
Copper prices struggled from the very start of 2015, breaking from 2014’s trading range to nosedive below $6000/mt. This was partially an extension of the oil price sell-off, but also a result of fears over global economic stagnation in the eurozone over the next two years, oversupply in the market, and slowing demand from China (which accounts for about 45% of global copper demand). More recently, following a healthy rally throughout May, copper prices hit a 6-year low on July 7, again with China’s stock market volatility being the prime factor for the drop. Copper’s forward curve also switched from backwardation to contango in Q2, a sign that the market is well supplied.
Soft Commodities
Softs have had a rough time during H1. No.11 Sugar futures, for example, ended the half down 20.4%, while coffee prices are now at their lowest in over a year, with ICE coffee futures recently trading at $1.25 a pound.
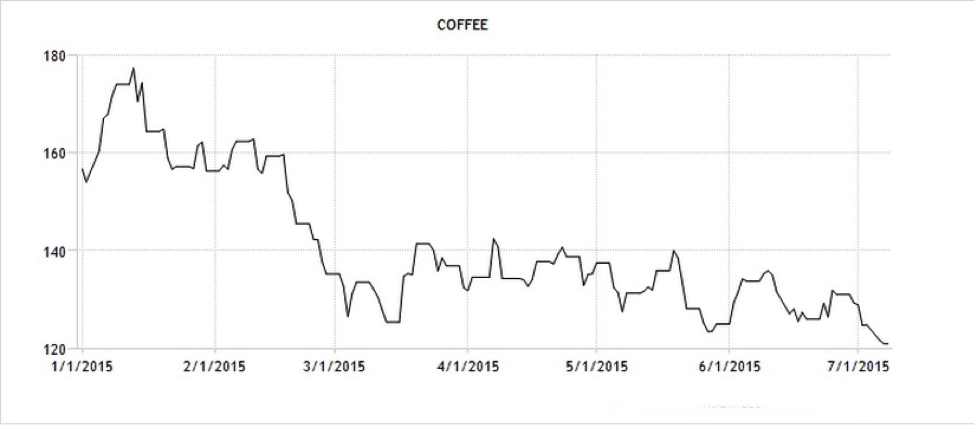
Coffee has followed a downward trajectory throughout H1, as the value of Brazil’s currency, the real, fell almost 30% against the dollar between late January and March 20, at which point it hit a 12-year low. Brazil produces around one-third of the world’s coffee and the currency depreciation attracted heavy selling for the export market, which dampened the market price. The price fall in 2015 has not dissuaded Starbucks from concurrently raising its price on coffee drinks, however. Starbucks raised prices last June when coffee prices averaged $1.75/lb and has done the same in early July by $.05 to $.20 despite the lower futures prices, stating “the need to run our business profitably.”
The TSX and the Canadian dollar have both been impacted significantly by the slowdown in commodities markets and, in particular, the crude markets. On June 4, for example, the TSX posted a 135.29 point drop to 15,019.39, thanks to a $1.64/bbl decline in WTI to $58.00/bbl, as well as a $9.70/bbl drop in gold to US $1,175.20/oz. The utilities and energy sectors were the biggest losers on that day. More recently, July 7 witnessed a day of heavy losses for oil, gold and copper, triggering a 0.37 of a US cent fall in the CAD to 78.67 cents.