
 In the first half of this decade, commodities markets experienced a sizeable degree of volatility. Many commodities performed exceptionally until around 2012; from 2013 onwards those sharp gains have been pared, and indeed, we are now in loss-making territory for several commodities when compared with 2010-2012.
The S&P GSCI is a benchmark measure of composite investment performance in 24 liquid commodity markets. Grouped in their broader classes – energy, agriculture, and base and precious metals – the following graph shows how commodities have performed throughout the 5-year period:
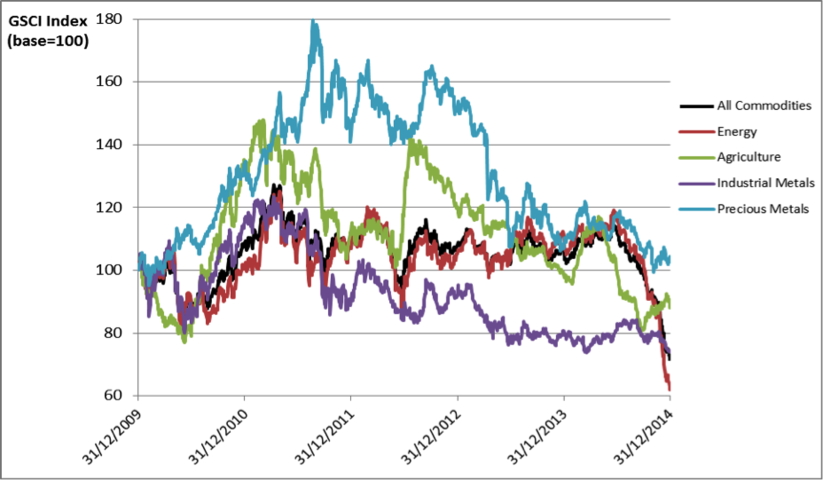
(Source: S&P GSCI)
Precious metals and agriculture were the best-performing classes over the period. Energy products tracked the composite GSCI with a very high degree of correlation – not surprising given that energy contributes a 70% weighting to the overall index (with agriculture 15.3%, base metals 6.75% and precious metals 3.25%). Base metals performed the weakest of all.
The following graph highlights the best of the individual performers:
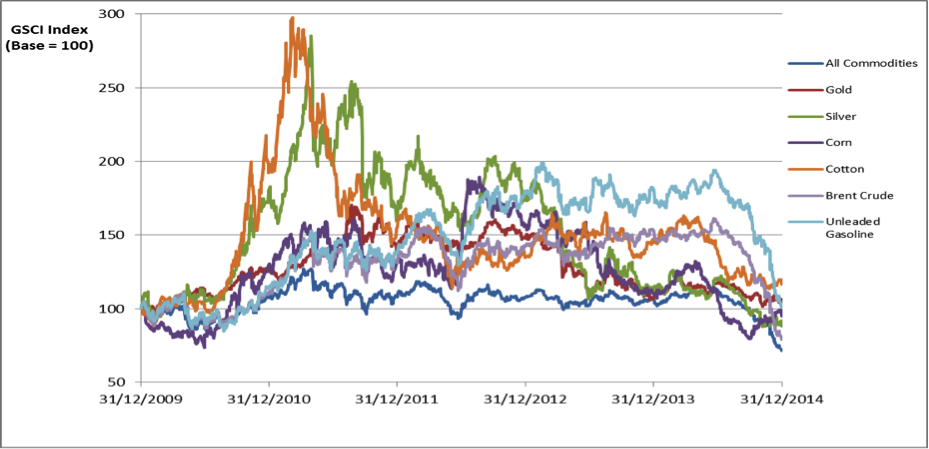
(Source: S&P GSCI)
Agriculture
The first commodity to experience a pricing boom was cotton, in late 2010, caused chiefly by accelerating demand for imports from China, the world’s largest cotton consumer. The Chinese government also began buying up all domestic cotton production at a much higher price than the world price, to put into reserve, which supported prices further. Major supply contractions in Pakistan, Australia and China, due to flooding, also inflated the market price.
Rising prices triggered higher production and lower consumption levels. After peaking around March 2011 at over $2 per pound, supply significantly began to exceed demand, causing prices to fall dramatically. Since then, however, cotton has performed comparatively well, mainly because China has imported and absorbed the excess global production and therefore has effectively supported the world price.
The other agricultural product which performed well was corn. Although corn didn’t experience a boom-bust cycle like cotton, it performed consistently well between late 2010 and 2014. The market peaked in 2012; again, aggressive Chinese buying and supply constraints underpinned the higher prices. However, supply issues resulted from a large drought in the US, easily the world’s biggest corn producer, causing a reduction in stock levels that severely tested the amount of spare capacity in the industry.
Precious Metals
Strong Chinese demand also supported the 2011 rallies in silver and gold. Silver in particular experienced a dramatic price rise from $18/ounce in early 2010, to $49/ounce in April 2011. The rallies were attributed to a loose monetary policy in the US with the Federal Reserve still implementing quantitative easing, a weak US dollar which encouraged foreign investment in dollar-denominated metals, and strong demand from China and India.
Energy
The two standout energy performers in the last five years were gasoline and Brent crude oil, the price of which has significantly diverged above and away from its US counterpart, WTI. Brent is now the global benchmark crude grade – indeed, its weighting in the S&P GSCI is set to overtake WTI in 2015 (24.7% vs 24.47%). Strong Chinese demand, sizeable speculative length in the market and tight output limits imposed by OPEC, which consistently argued against raising output on the basis that the this speculation was the driver of inflated prices (rather than market fundamentals), kept the crude market above $100/bbl, especially prior to 2013.
Of all refined oil products, gasoline showed the most strength, despite the fact that between 2007 and 2013 US output increased by 28% and demand dropped annually by 6.7% on average. The rising price was mainly due to an exponential increase in the cost of ethanol credits that refiners, as mandated by US law from 2007, had to buy and which represented a minimum level of ethanol that had to be blended with the processed gasoline. Much of the increase in the credit costs since 2007 were therefore passed on by the refiners to consumers, as reflected in the inflated retail price.
Outlook
All the aforementioned commodities experienced a significant downturn in the latter half of 2014, with Brent crude losing almost 50% since mid-June amid high output levels from OPEC. The high OPEC levels were due to the return of market output from Iraq and Libya, the US shale boom, growing Canadian oil sands output, and weaker global demand, especially from China. Oil is expected to remain around $60/bbl for much of 2015 in the face of subdued OECD demand growth, higher non-OPEC production and possible influence from lower natural gas and coal prices, which may have a convergence effect on oil.
Chinese demand has slowed considerably, with import levels in November falling by 6.7%. This factor may prolong weakness in commodity markets across the board throughout 2015.
Cotton markets have had five consecutive seasons of production exceeding consumption, with prices falling 17% in Q3 2014 alone. The World Bank expects this market imbalance to continue through next season, so prices will likely drop further. As for precious metals, the World Bank predicts a further 2% price drop in 2015 on the assumption of an expected interest rate increase by the Federal Reserve, which will likely cause a shift in investor funds from gold and silver into riskier assets.