CWAN Biannual Commodities Update – January 2018
 As an asset class, commodities turned in a decidedly mixed performance during 2017, with pronounced winners and losers emerging by the end of the year. As such, the Bloomberg Commodity Index managed to squeeze a 0.7% gain from the previous year.
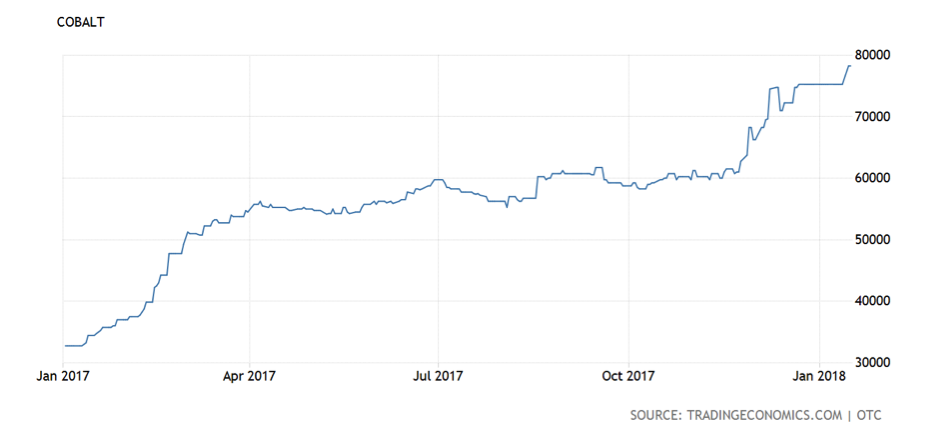
The base metal cobalt was the best-performing commodity of 2017; prices surged consistently during the year, with the metal quoted on the LME ending at $75,500. This was a 129% gain from one year earlier, as supply fears and a huge demand spike from battery markets combined to generate significant bullish sentiment.
Copper also performed well consistently during the year:
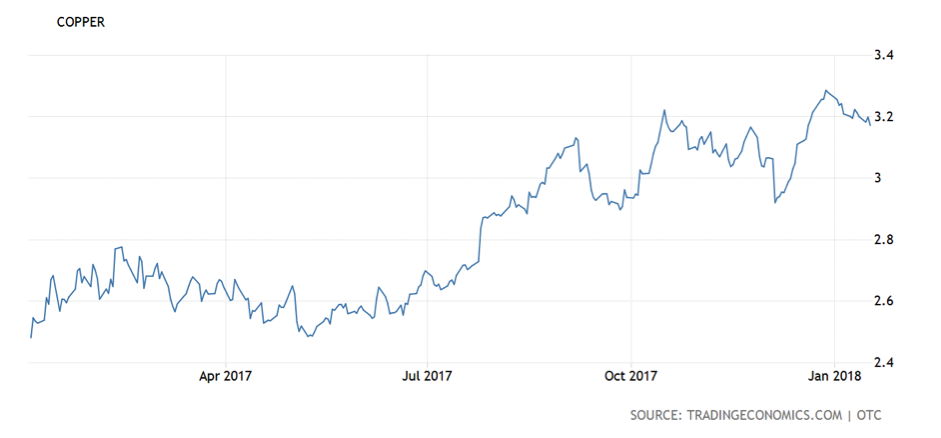
Strikes during Q1, which at one point reduced global output by one-tenth, was the initial contributing factor, before talk of a Chinese ban on scrap imports helped to extend the rally during the year. And finally, dollar weakness and expectations of a demand spike in coming years on the back of an electric vehicle boom meant the red metal finished the year brightly.
The best performing precious metal was palladium, which managed to climb 55% during the year, largely thanks to robust auto sales which boosted demand for a metal that is extensively used in catalytic converters to prevent pollution from gasoline-fuelled engines. It is estimated that 80% of global palladium demand comes from auto-catalysts for gasoline-powered cars. It is also worthwhile to note that the Volkswagen emissions scandal has seen many car owners switch to gasoline over diesel-fuelled vehicles. Expectations of a supply shortfall over the next few years also added to market tightness, with Morgan Stanley forecasting that production will continue to lag behind consumption until at least 2022. Moreover, the metal surged in December after inventories in warehouses tracked by NYMEX recorded a 25% drop during the month, thus representing a fourth consecutive annual decline – the longest streak since 2000.
Cotton prices rose by almost 9 cents per pound last year, which represented an increase of approximately 6%. According to the USDA, cotton stocks outside of China were expected to grow by nearly 25% during the year, to their highest all-time level. But while such an expansion would normally be associated with a fall in price, revised global production and mill-use estimates indicate supply has actually been tighter than many forecasters previously thought. “The increase in prices has occurred despite expectations for a big increase in supply outside of China,” said Jon Devine, chief economist at Cotton Incorporated.
US WTI oil prices ended 2017 at $60.42/bbl, with the final trading day of the year also marking the first time since mid-2015 that they surpassed the $60 mark. It also meant that US crude ended 2017 with a 12% gain, largely bolstered by strong demand and declining global inventories. A recent pipeline explosion in Libya and an agreement (which has now been extended) to reduce output by OPEC and other major oil producers including Russia also helped to support higher prices during the year.
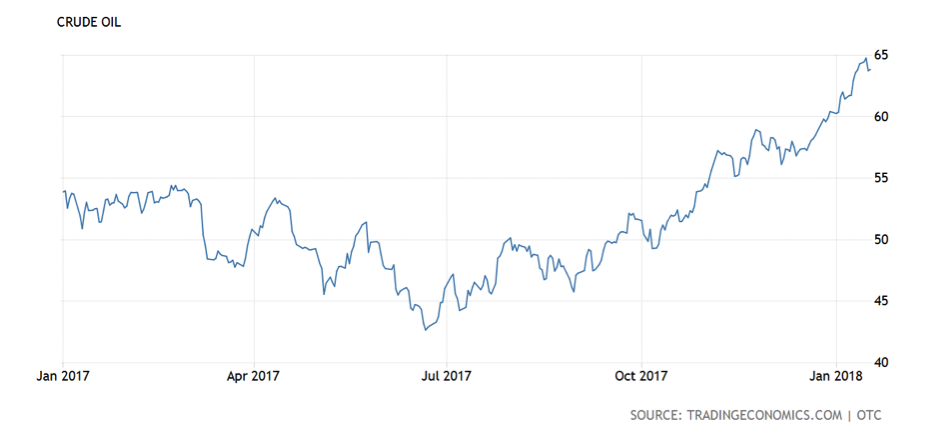
Furthermore, oil has extended its bull-run into 2018, with Brent crude touching $70/bbl, a level it last saw three years ago. The OPEC-Russia output agreement, healthy global oil demand, and a boost in imports to India all continue to underpin the strength in the North Sea oil grade. India, the world’s third-biggest oil consumer, experienced a 1.8% rise in oil imports last year to a record 4.37 million barrels per day (bpd), as the country boosted purchases to feed its expanded refining capacity.
Natural gas spot prices at the US national benchmark Henry Hub in Louisiana averaged $3.01 per million British thermal units (MMBtu), about 50 cents/MMBtu higher than in 2016. Mild winter temperatures early in the year limited natural gas storage withdrawals, with the first-ever net injection recorded in the month of February. As a result, natural gas storage inventories ended the injection season lower than last year but higher than the previous five-year average.
The story in Canada, however, was starkly different with AECO gas prices entering negative territory during the third quarter.
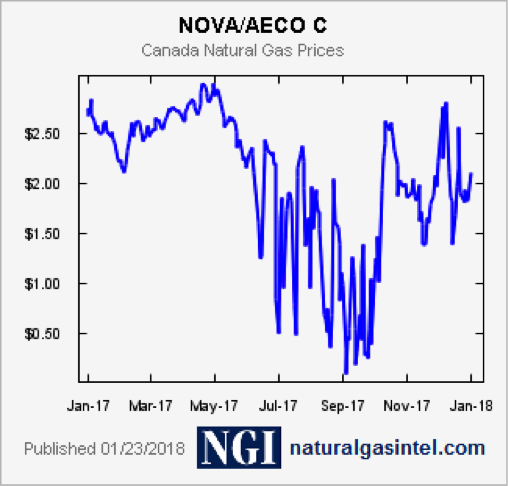
Problems pertaining to too much supply in Alberta (production spiked in late 2017, jumping about 10% during an eight-week period), weak demand, and pipeline constraints to move gas to market all conspired to depress prices, while several companies have slashed their spending plans and will drill fewer wells going forward.
Gold also performed well last year. Investors continued the trend set in 2016 by adding gold to their portfolios in response to looming economic and political uncertainty – indeed, a substantial $8.2 billion flowed into gold-backed ETFs during the year. The benchmark troy ounce gold price also rose 13.5% over the 12 months, marking its best year for growth since 2010.
Gold’s ‘younger sibling’, meanwhile, was significantly more rangebound during the year, but nonetheless silver finished around $0.80/ounce higher at $16.98. The beginning of the year, however, saw more optimism for the silver price as the new Trump presidency brought with it hopes of higher silver demand via industrial applications, as many expected greater federal spending on infrastructure and construction. And although by March, silver had gained over 15%, optimism had dissipated by July.

